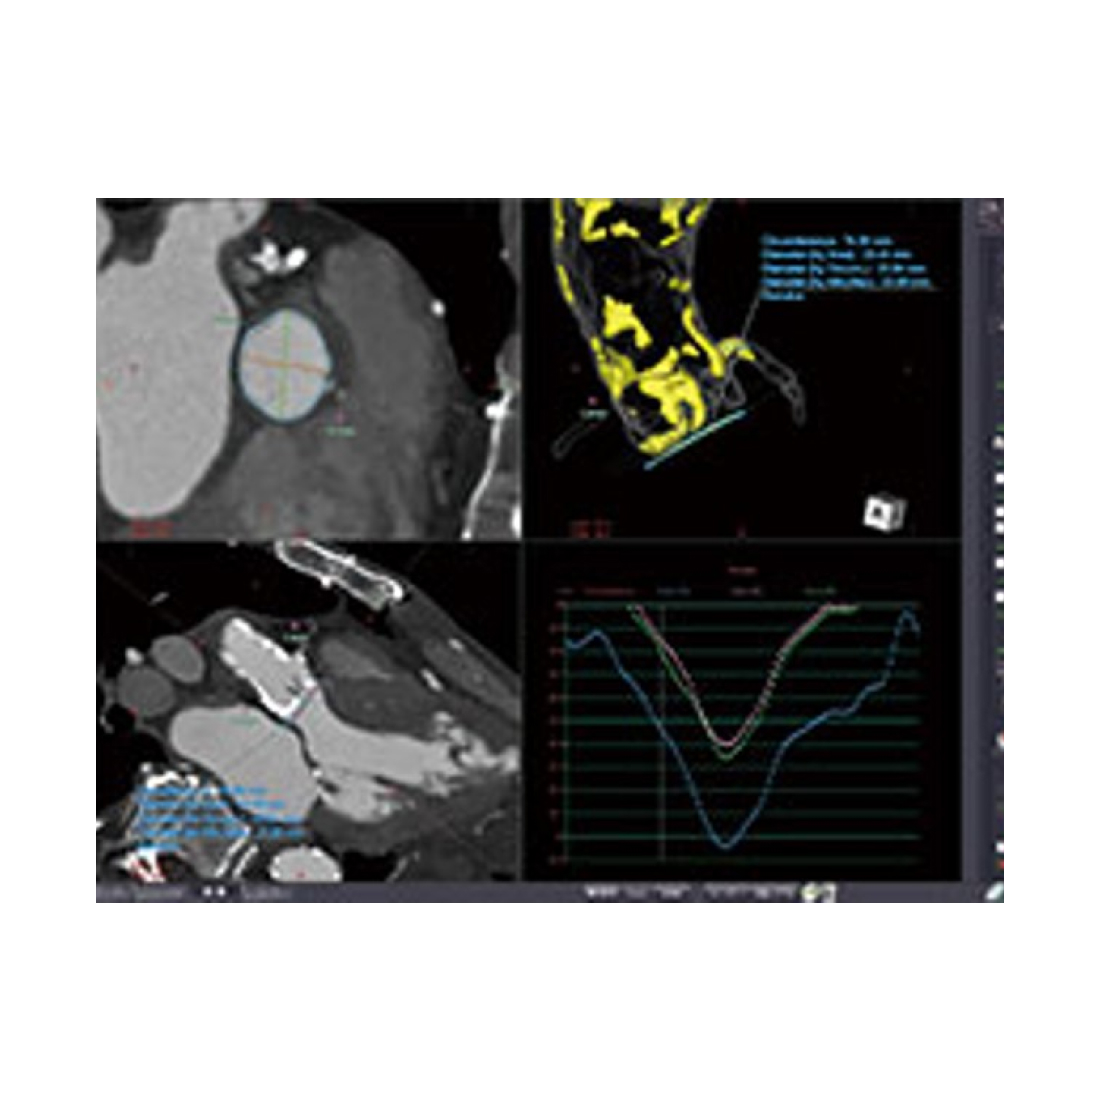
TAVR
This protocol allows comprehensive pre-procedure annulus assessment using static and dynamic measurement tools. Assessment tools are also provided for femoral/iliac and apical access routes. Surface rendering, automatic extraction of the annulus plane, and SCCT-compliant measurement and reporting tools are included.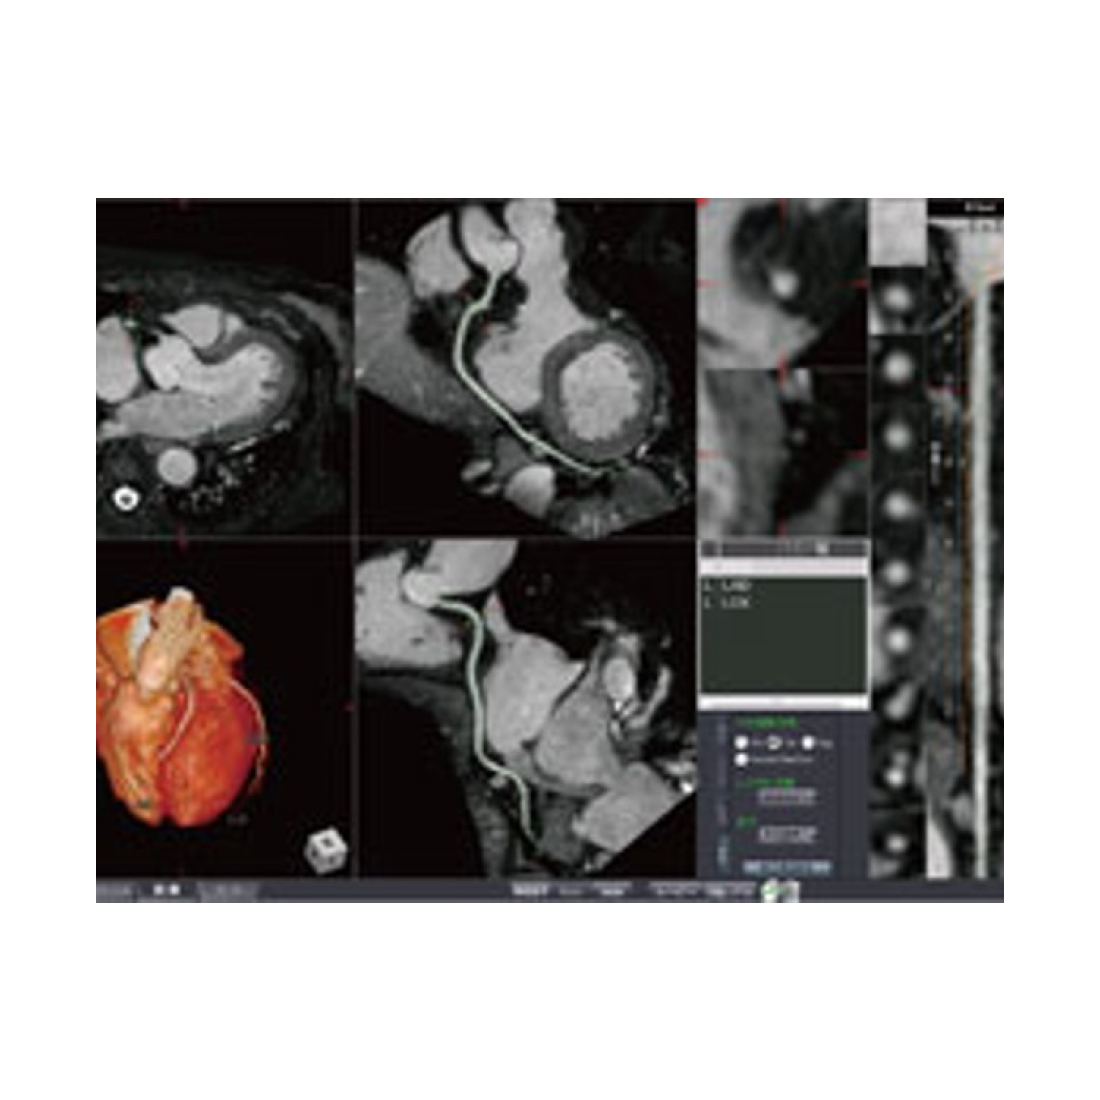
MR CORONARY ANALYSIS
With contrasted MR images, this protocol extracts coronary arteries and displays the results in MIP, CPR, and Straight View. Calculation of vessel stenosis is available.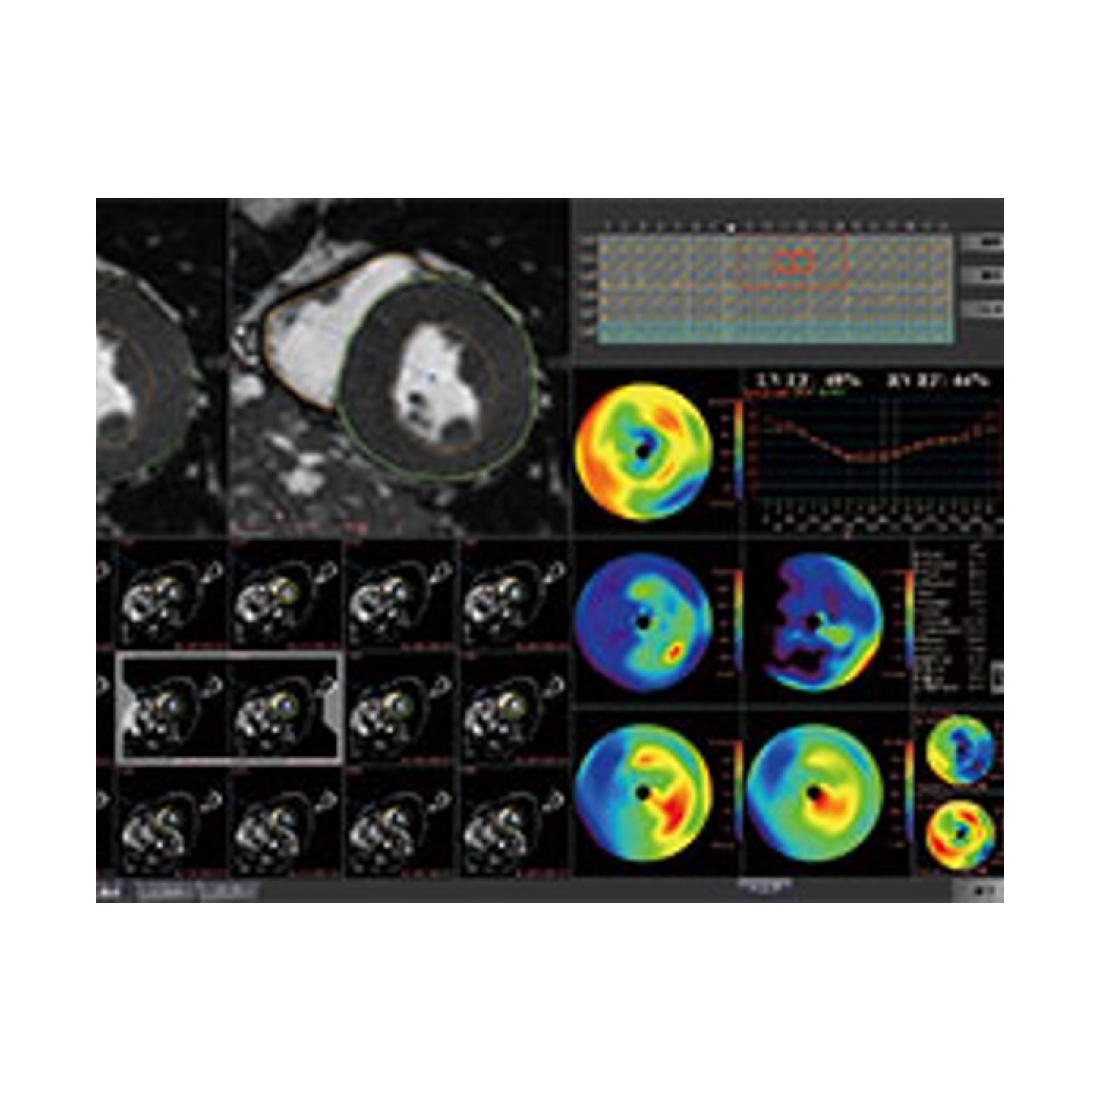
MR Cardiac Function
Utilizing multi-phase MR images of the heart, this protocol segments the inner and outer walls of the left ventricle, and calculates ejection fraction, wall thickness, wall thickness ratio and regional wall motion.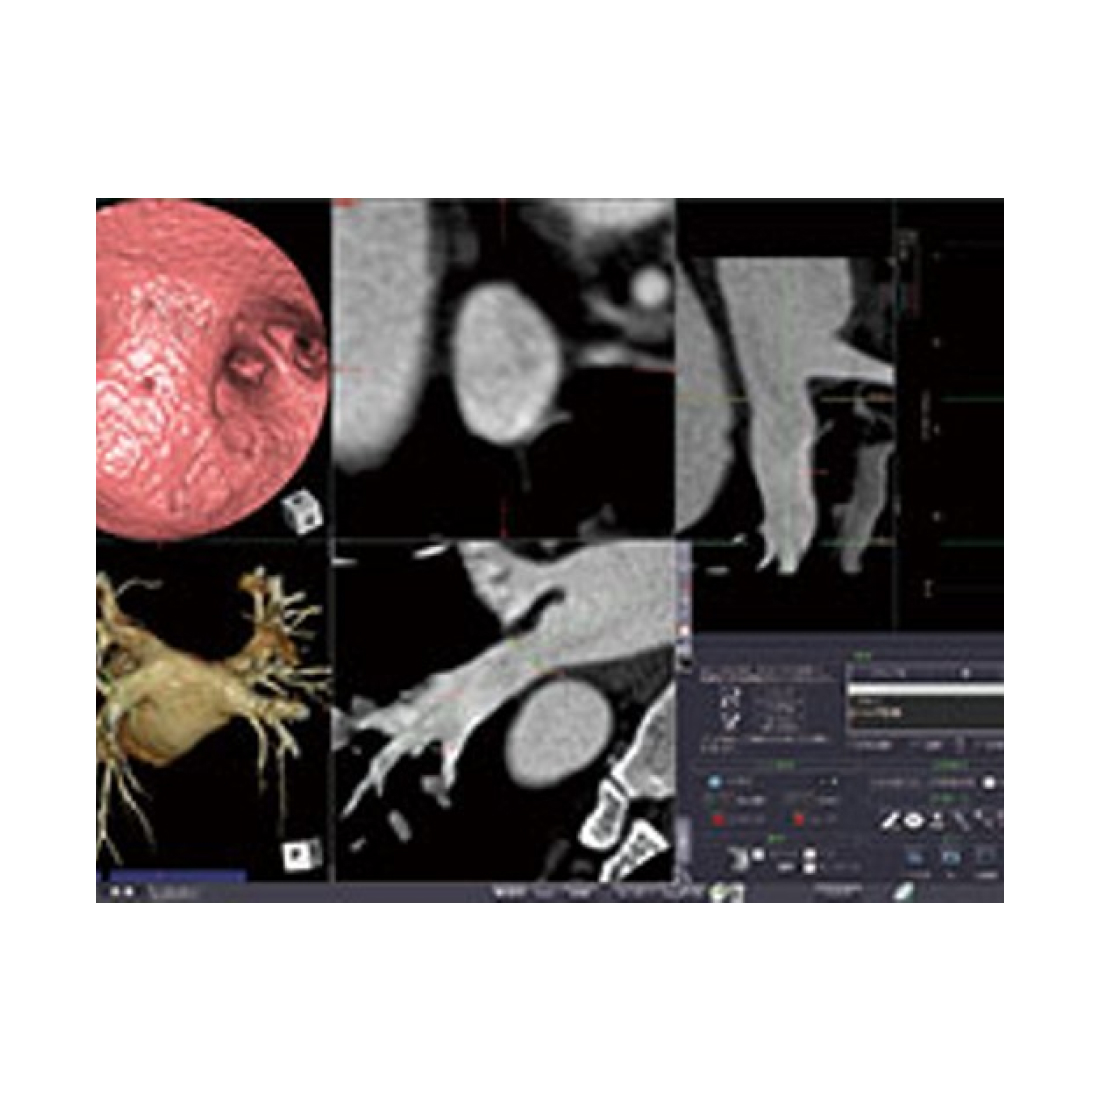
EP PLANNING
Automatically extract pulmonary veins and left atrium, display centerlines and lumen boundaries and provide measurements to enable analysis and assessment in support of EP Planning.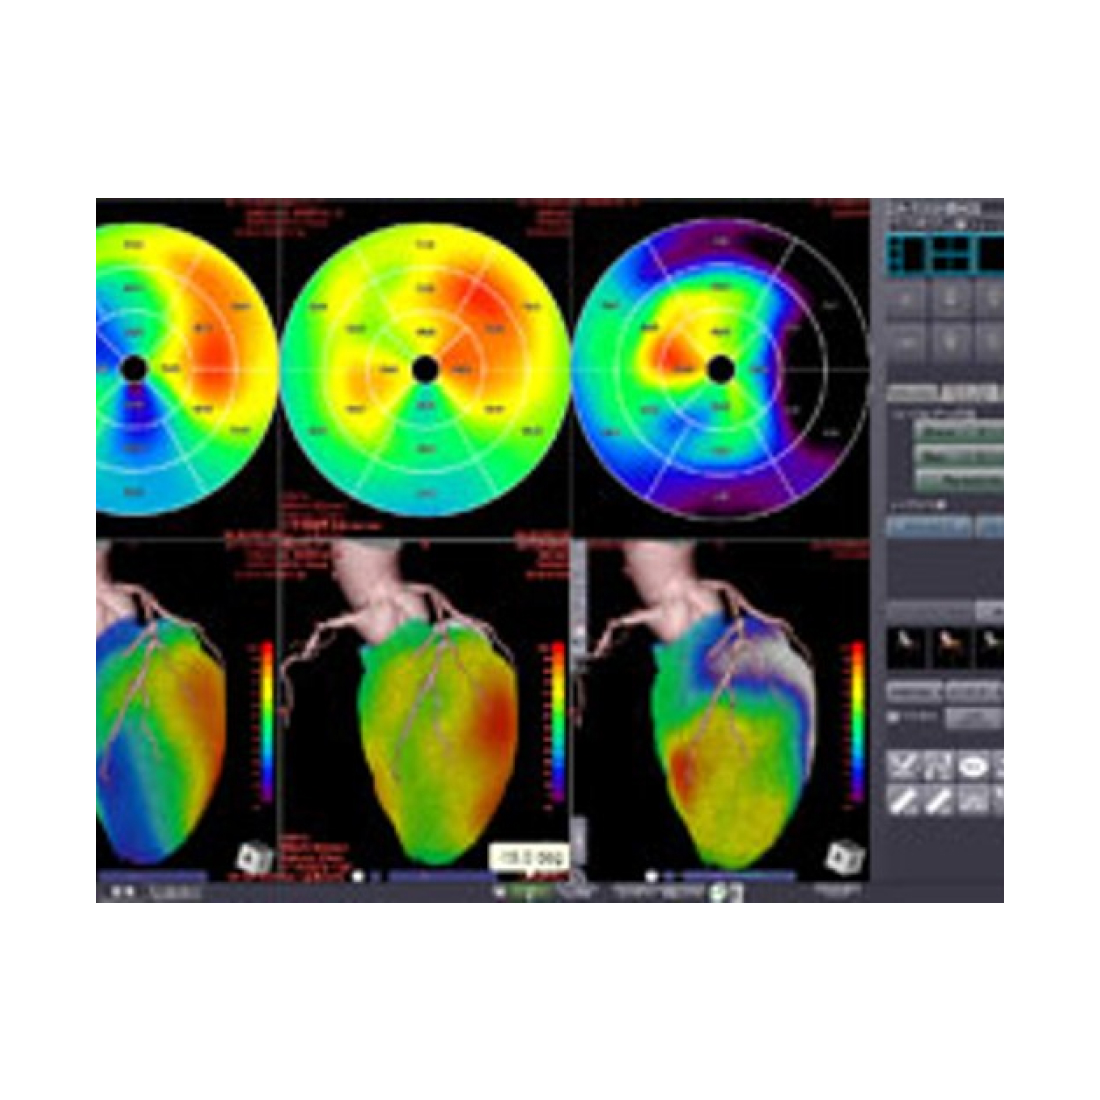
CT/SPECT CARDIAC FUSION
This protocol fuses functional (SPECT) and anatomic (CT) cardiac studies, supporting analysis of stress, rest and reversibility.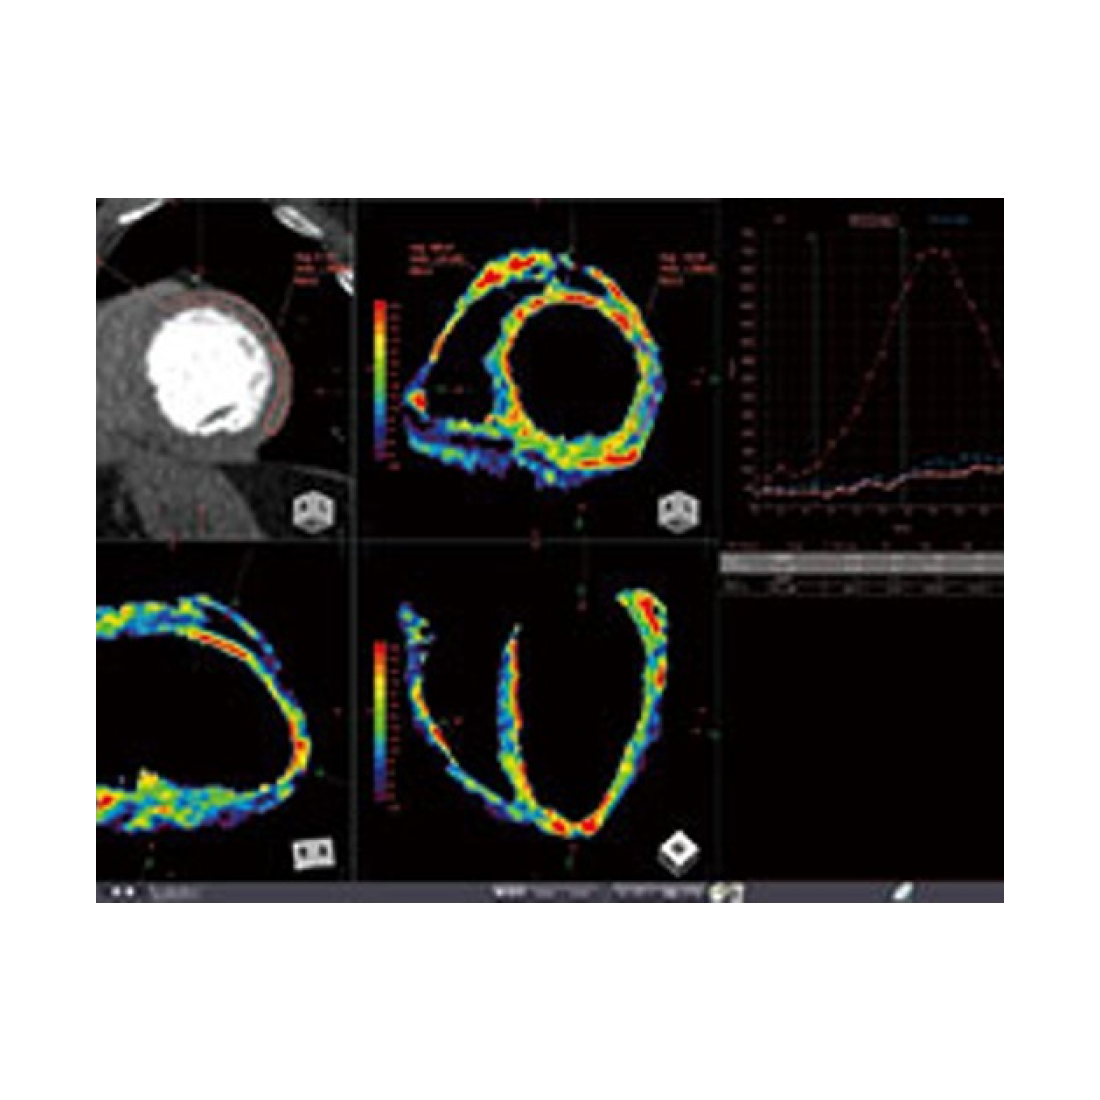
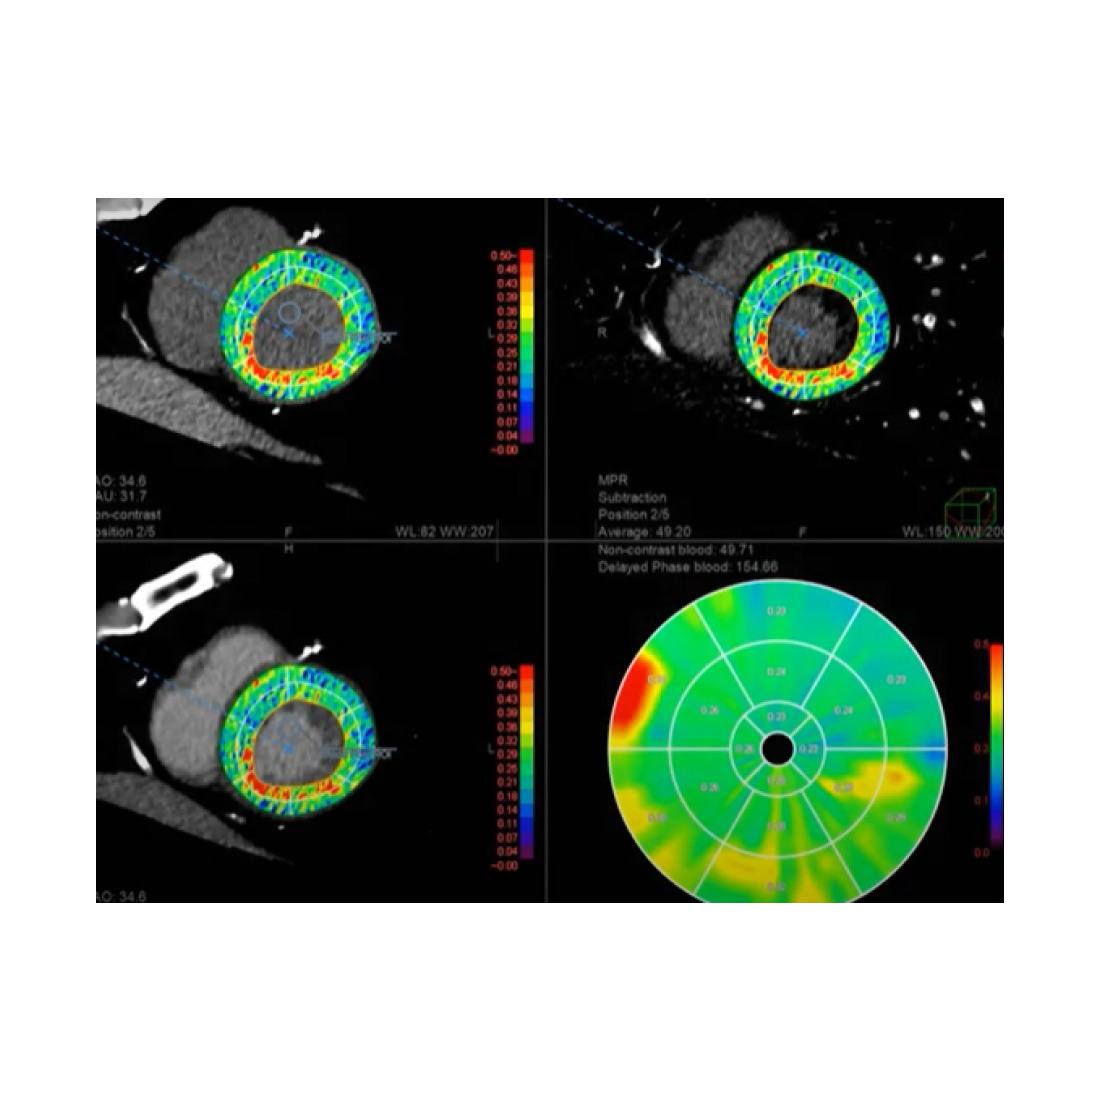
CT MYOCARDIAL PERFUSION
Using the stress and rest data of the heart scanned with a contrast material, this protocol provides polar maps and 3D fused images to review transmural perfusion ratio of LV myocardial blood flow.
CT DYNAMIC MYOCARDIAL PERFUSION
Analyzes myocardial blood flow using contrasted CT images as volume data scanned at the same cross-section, showing changes over time. Non-rigid registration is supported.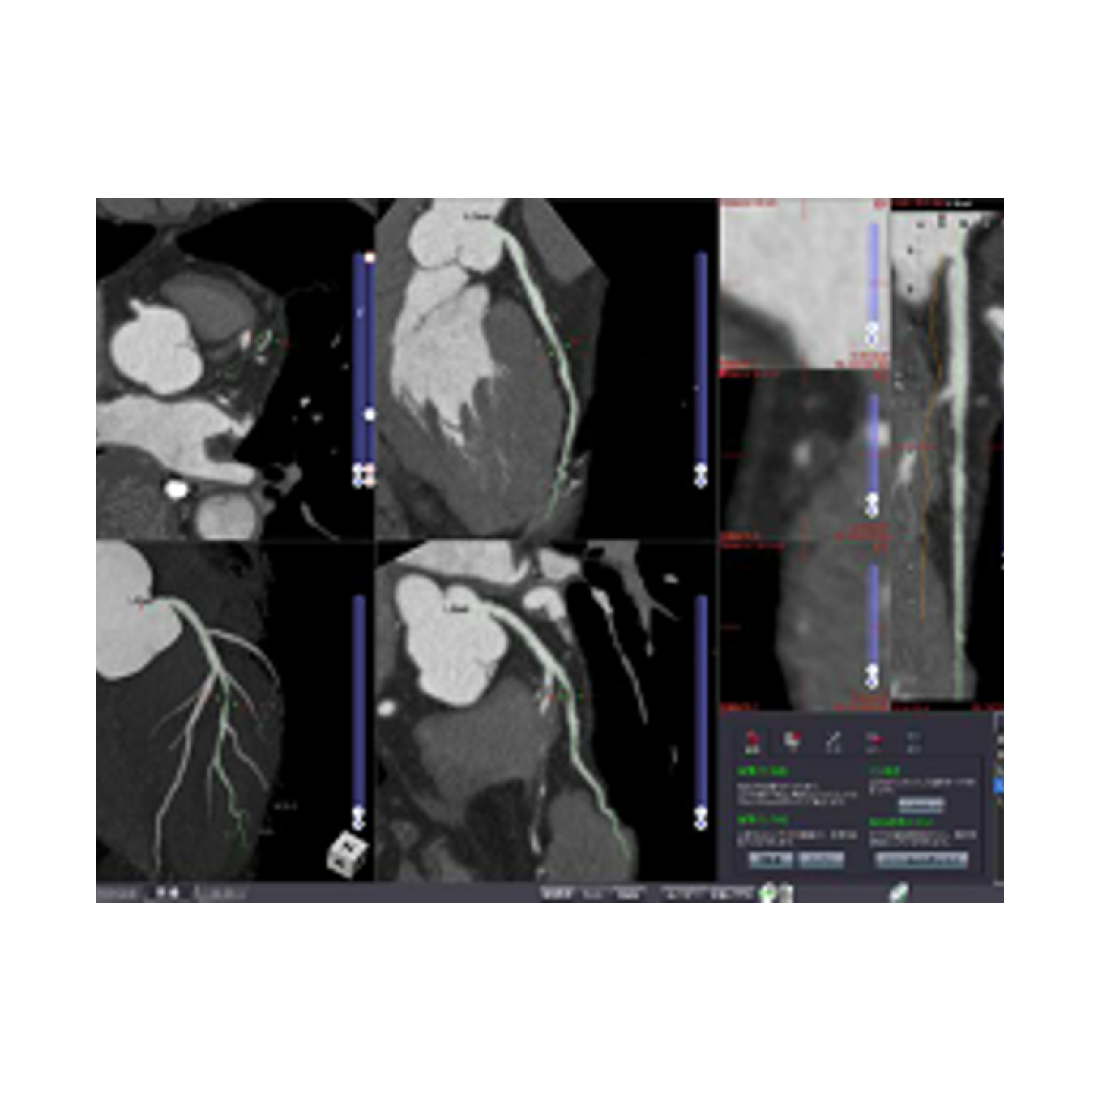
CT CORONARY COMPARE
The CT Coronary Compare protocol allows you to perform coronary artery centerline extractions and stenosis-related lumen calculations on calcium substrated data with ease.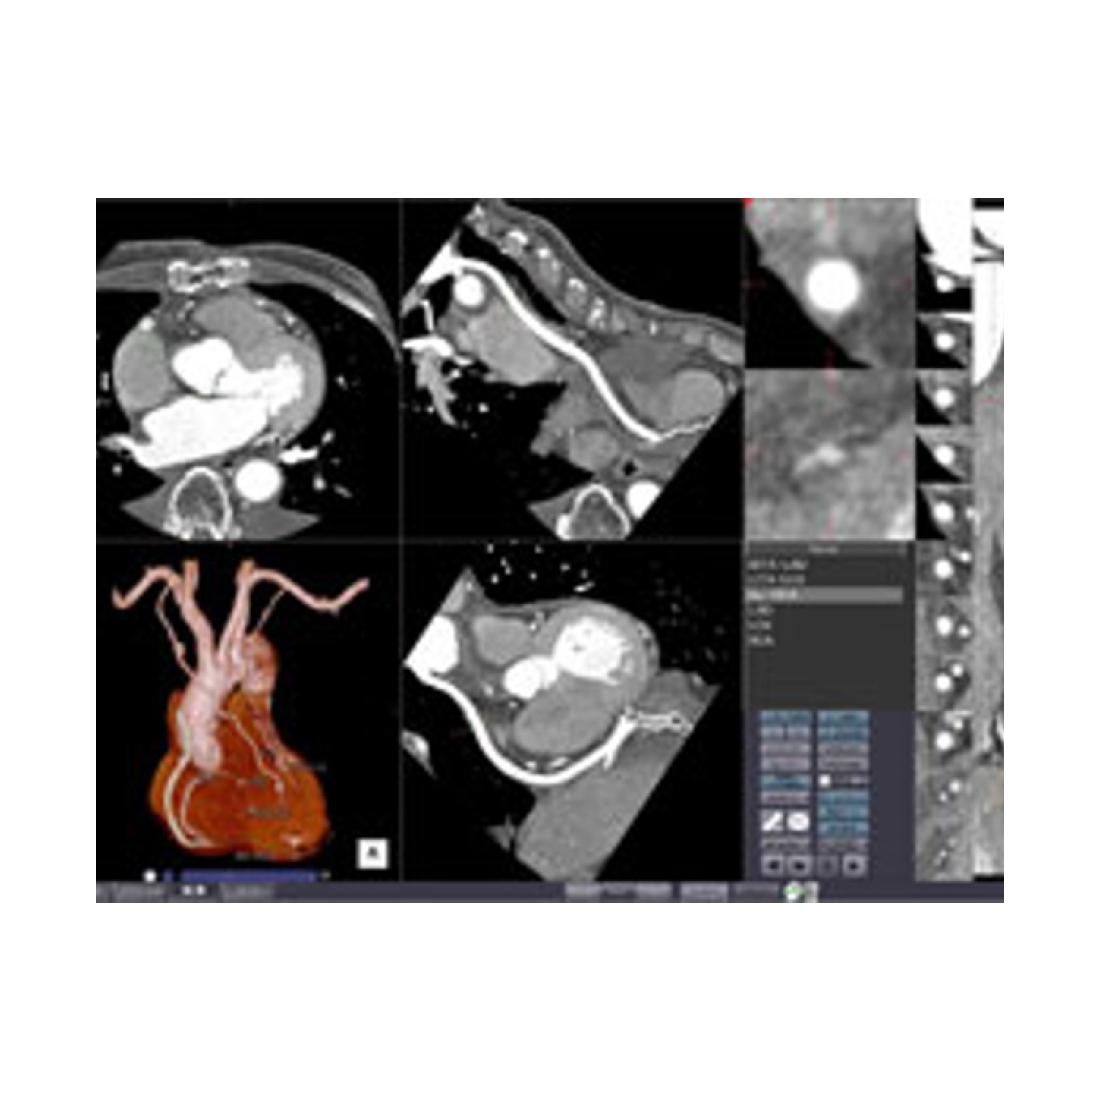
CT CORONARY ANALYSIS
With contrasted CT images, this protocol automatically extracts the coronary arteries and displays the results in views such as MIP, CPR, and Straight CPR. Calculation of vessel stenosis is available.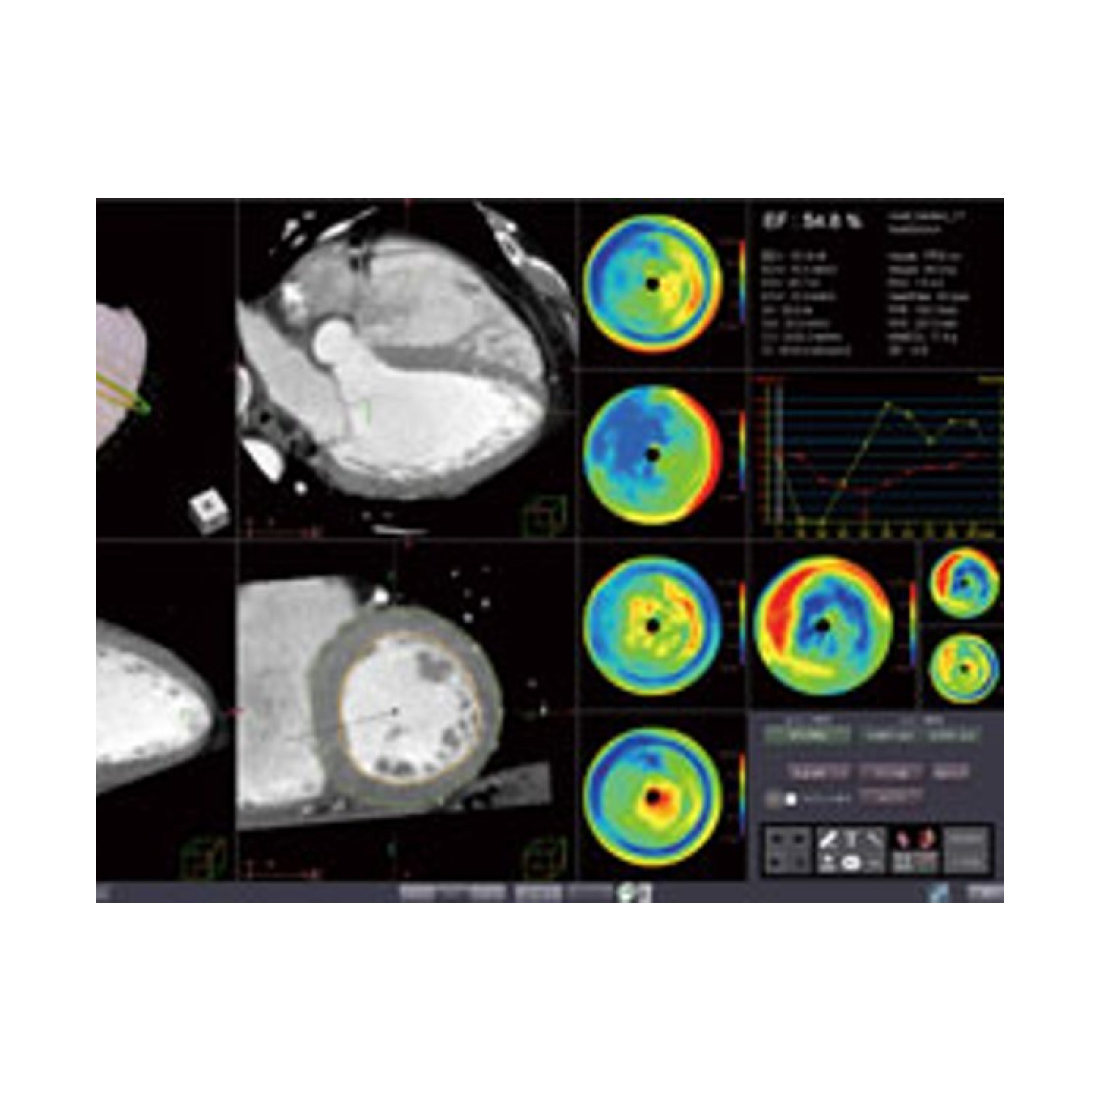
CT CARDIAC FUNCTION
Utilizing multi-slice CT images of the heart, this protocol segments the inner and outer walls of the left ventricle, and calculates ejection fraction, wall thickness, wall thickness ratio and regional wall motion.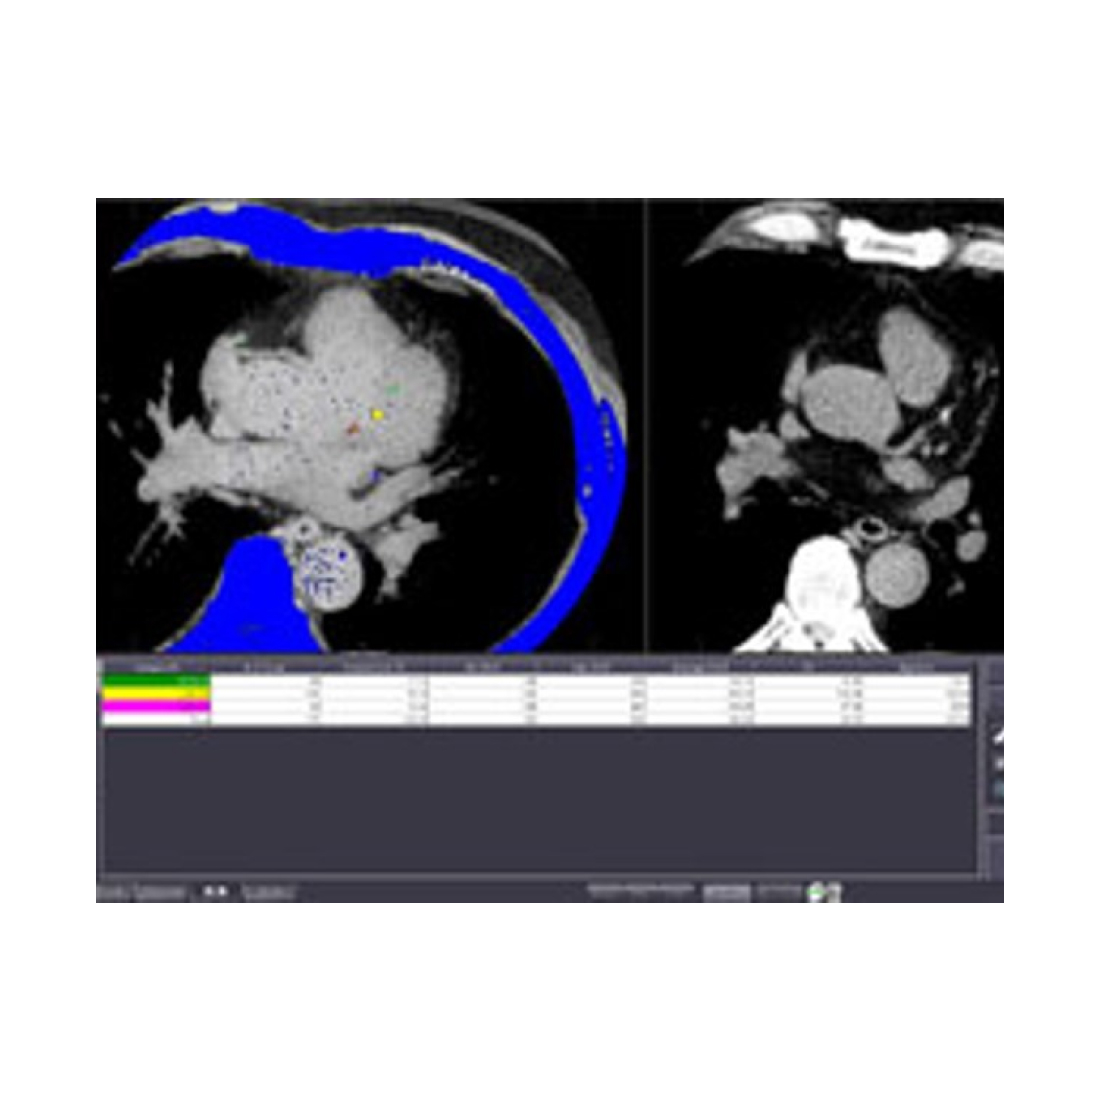
CT CALCIUM SCORING
Using non-contrasted CT, this protocol scores calcium in the coronary arteries.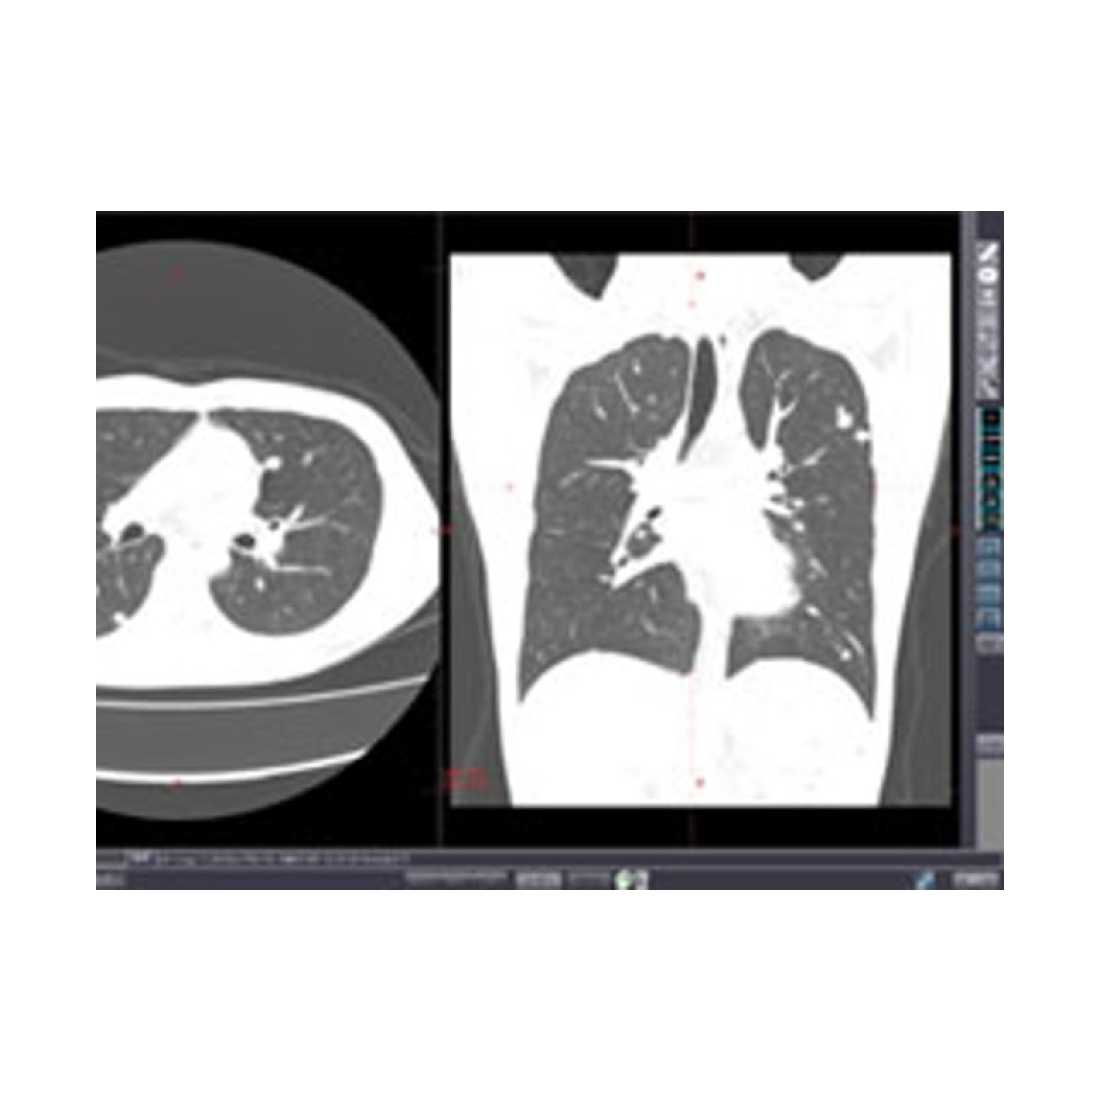
CINE VIEWER
View multi-frame angio data. Features include cine playback, changing playback speed and simple measurements.
CT CORONARY CALCIUM SUBTRACTION
Subtract coronary artery calcium and high-density areas and save the results as a new series. Use in conjunction with CT Coronary Compare for optimal visualization of the coronary vessel lumen.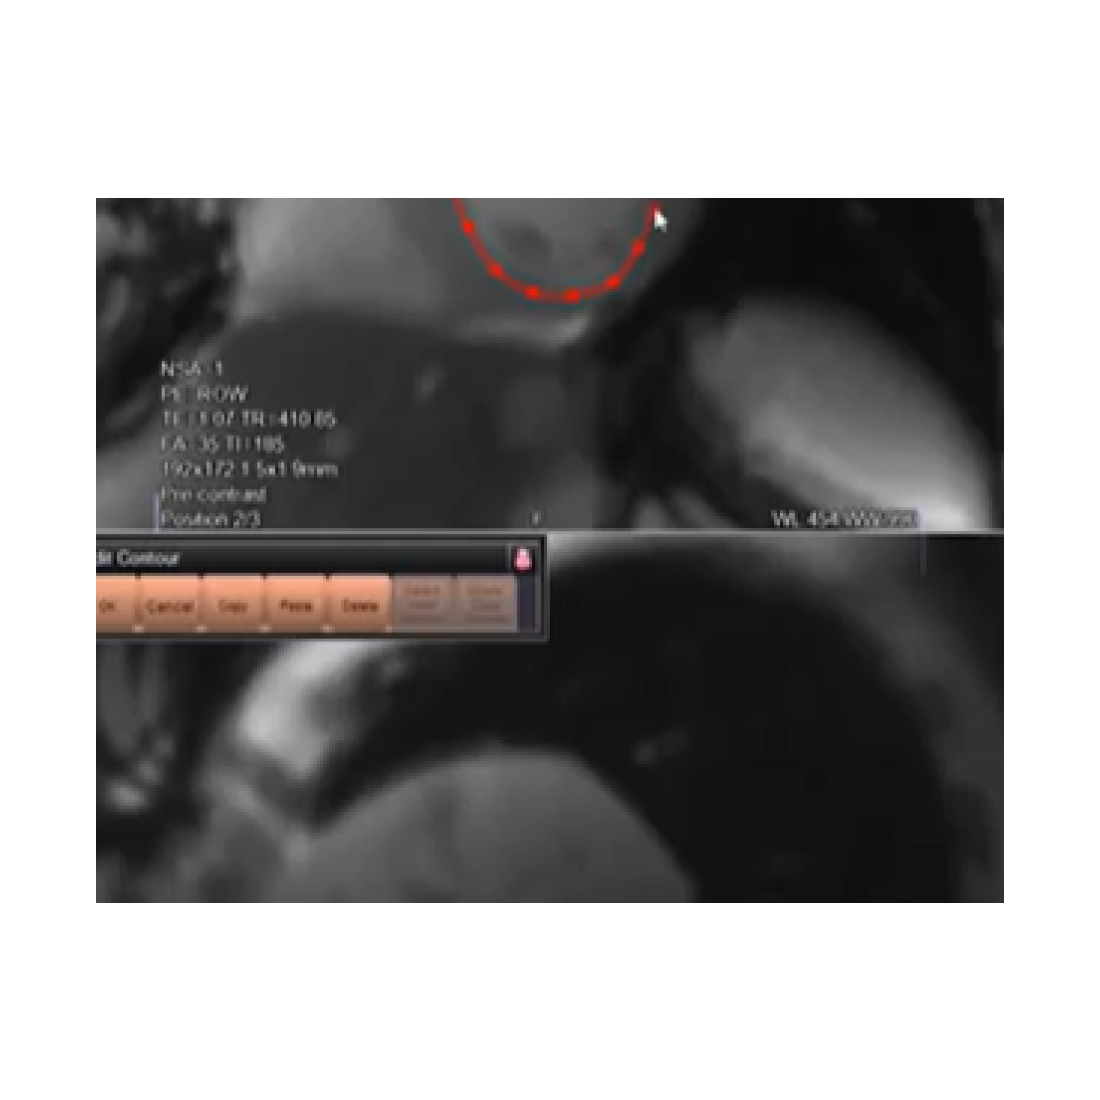
MR MYOCARDIAL T1 MAPPING
Using MR heart data scanned with and without a contrast material with different TI, this protocol extracts inner and outer wall contours of LV, shows color maps of T1 values calculated from T1 relaxation curve, and shows ECV calculated from hematocrit values and blood T1 values.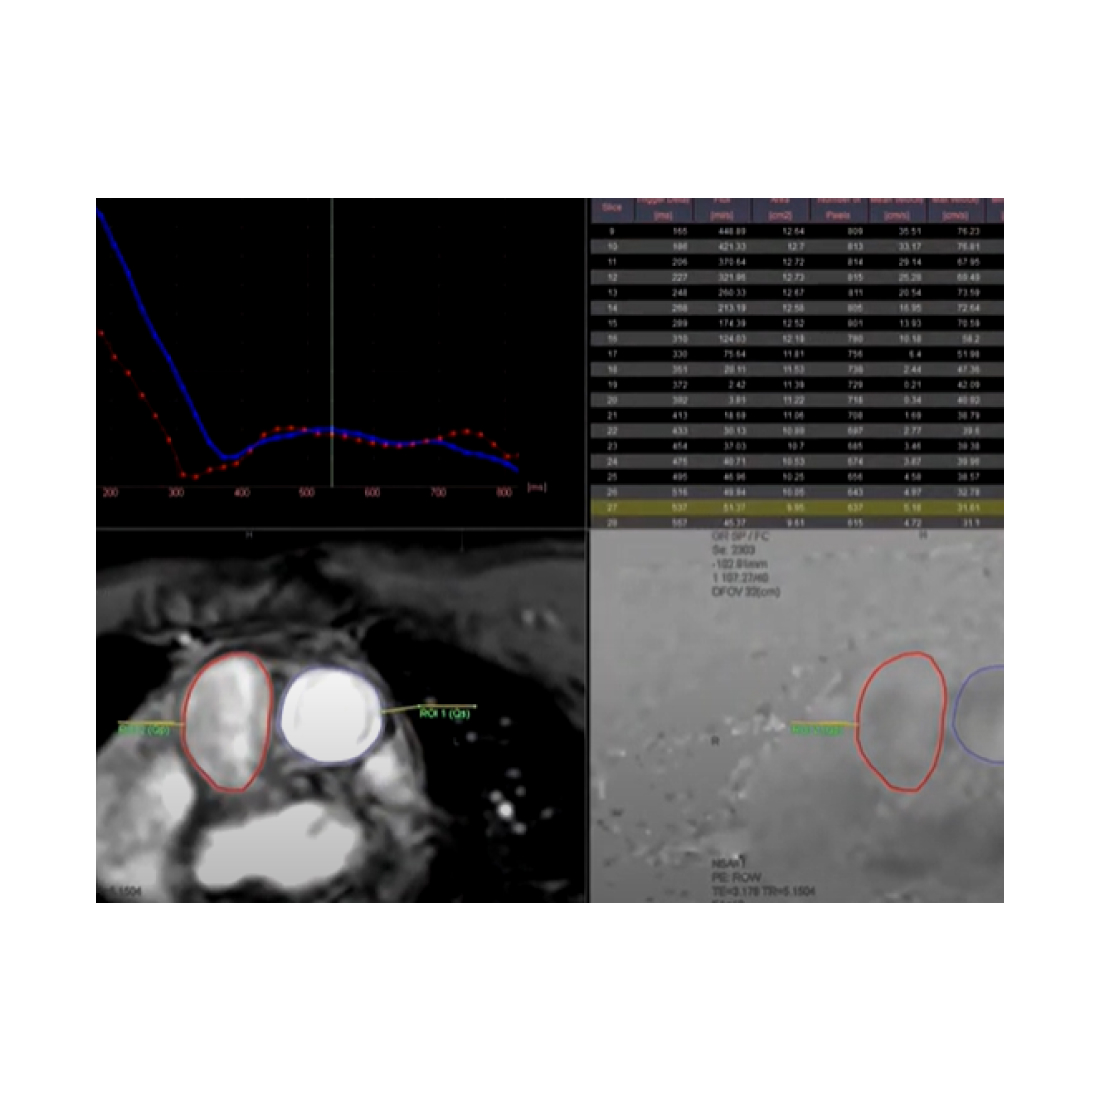
MR FLOW
Using phase contrast MR images, this protocol evaluates flux and velocity of a specified vessel.